
On my Raspberry Pi NTP server project, I implemented some really simple dashboards using an LCD display. While I really like these, they’re very limited in what they can show, and they don’t display historical data. To provide historical statistics and real-time graphing, I chose to use Grafana. In this article, I’ll be sharing some URLs on configuring Grafana to monitor a Raspberry Pi, GPSD, and NTPD.
Grafana is an amazingly pretty monitoring/graphing program. It provides a ton of visualization widgets including line charts, bar charts, pie charts, text boxes, oil gauges, and many others. To use it, you configure data collectors (collected, prometheus, bash scripts, etc). These collectors insert the data into a time series database like influxdb or prometheus. Grafana dashboards then query the database(s) for data and prepares charts. Here are some examples.
Getting Started Installing Grafana
Grafana is pretty intimidating to setup and the documentation is sketchy at best. Here are my notes on what I had to do to make it work. Note that I’m not going to provide the complete steps, but pointers to the best work people have already done.
Step 1: Install Influx DB and Grafana
The best source I found was this URL. It covers installing influxdb and grafana:
https://simonhearne.com/2020/pi-influx-grafana/
The one thing I would add to this is to create retention policies on your database. This keeps the gathered data from expanding to fill all available storage. It also affects CPU utilization. With around 6 months of data, I noticed that influxdb was using substantial CPU. I used:
CREATE RETENTION POLICY "4_WEEKS" ON "gpsd" DURATION 4w REPLICATION 1 SHARD DURATION 7d DEFAULT
The influx documentation has information on how to do this.
https://docs.influxdata.com/influxdb/v1.7/guides/downsampling_and_retention/
Another good reference for the Grafana installation on a Raspberry Pi is on the Grafana web site at:
https://grafana.com/tutorials/install-grafana-on-raspberry-pi/
Step 2: Install CollectD
apt-get install collectd
systemctl enable collectd
Next, configure collectd to export to InfluxDB. Create the file /etc/collectd/collectd.conf.d/influx-export.conf with the contents shown below:
LoadPlugin network
<Plugin "network">
     Server "127.0.0.1" "25826"
</Plugin>
Step 3: Install Telegraf
Installing telegraf is easy. All you need to do is use the Pi command line:
sudo apt install -y telegraf
systemctl enable telegraf
After you install telegraf, edit /etc/telegraf/telegraf.conf and configure it to point to the influxdb database created above. Locate the [[outputs.influxdb]] section and set the database name/path.
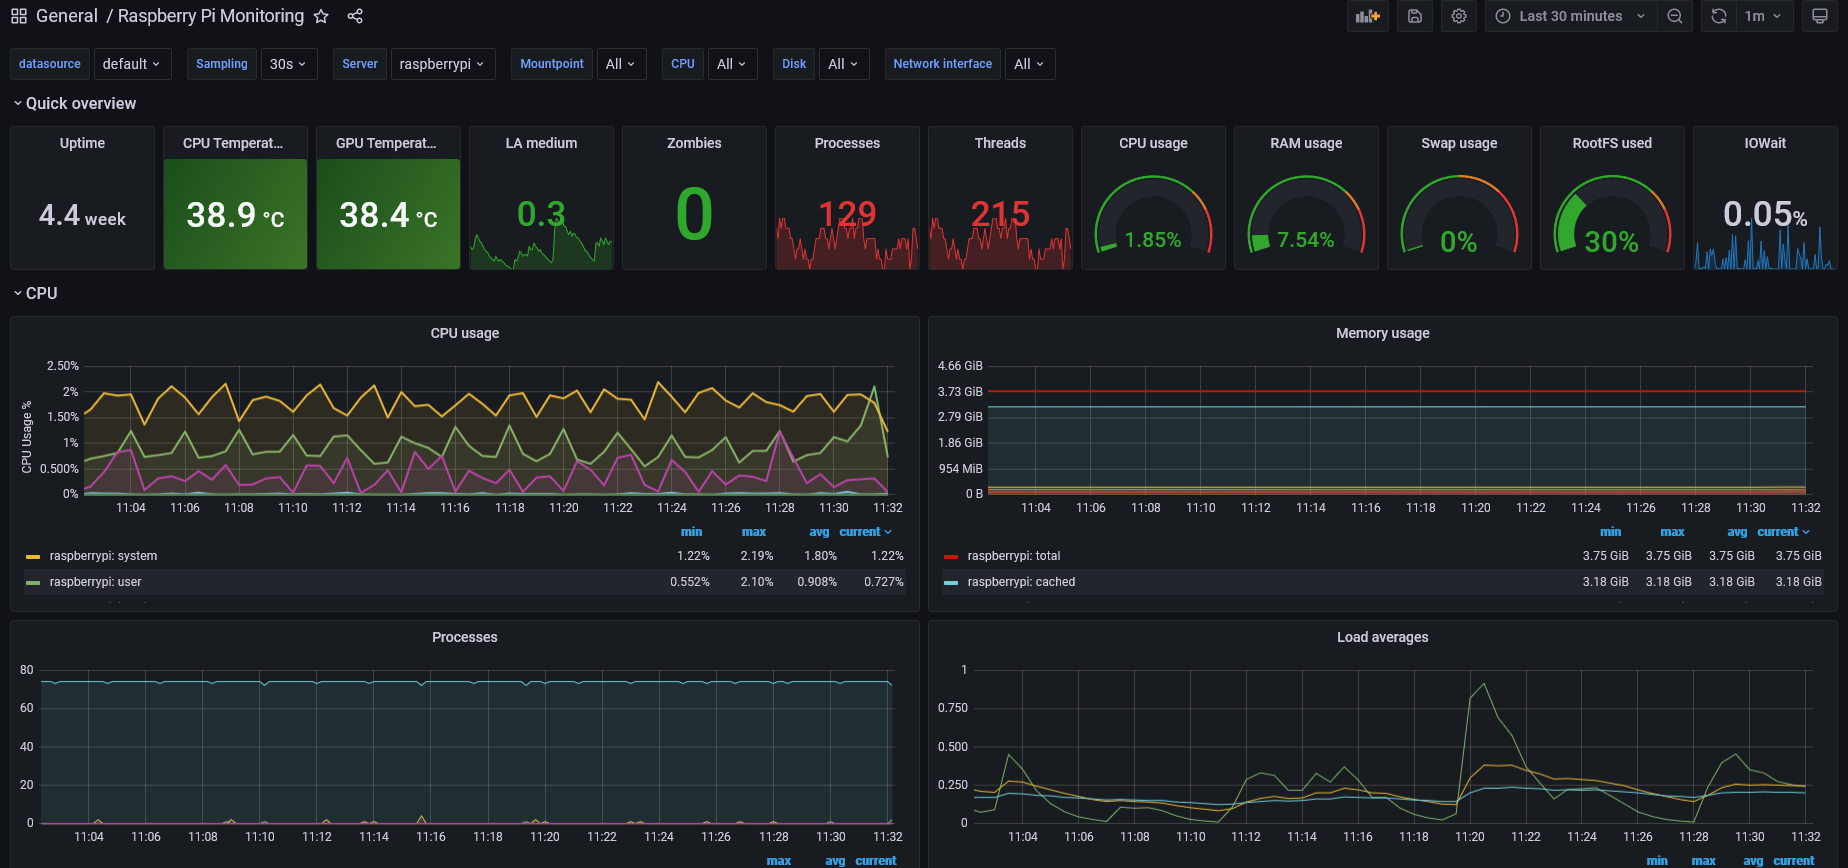
Step 4: Install the Raspberry Pi Monitoring Dashboard
In Grafana, choose Dashboards/Manage. Click on Import and enter the ID of the dashboard. You can find the ID on it’s Dashboard page:
https://grafana.com/grafana/dashboards/10578
On that page, you’ll see a section labelled **Collector Configuration Details**. Copy the contents into /etc/telegraf/telegraf.conf
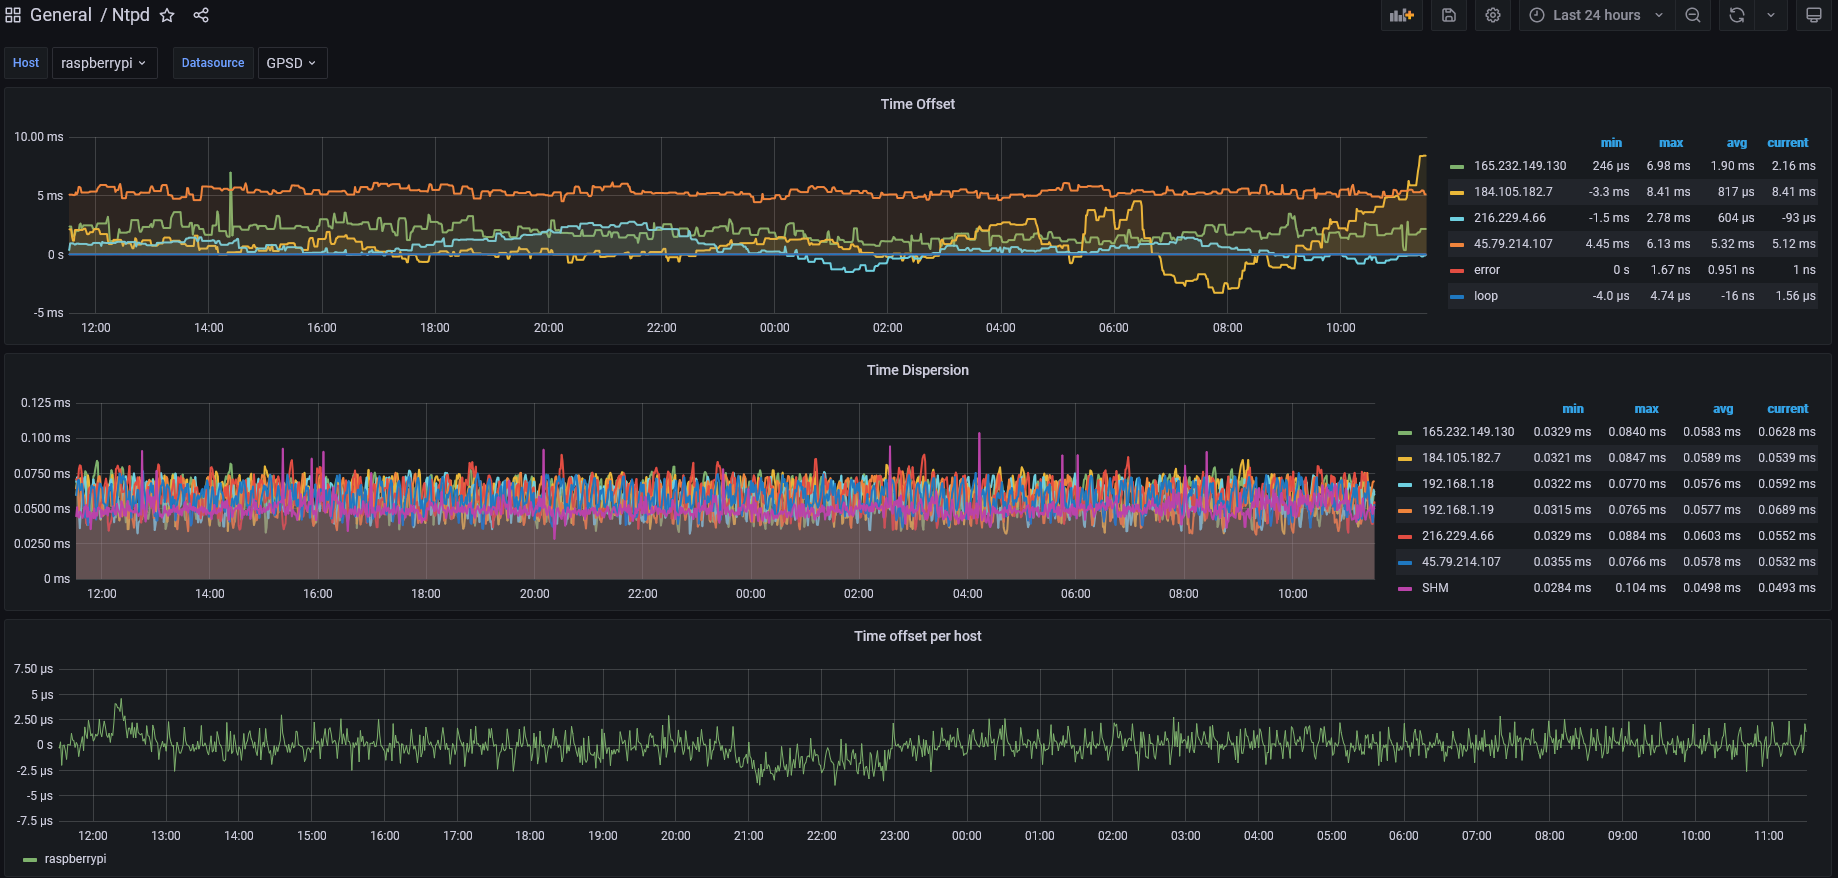
Step 5: Install the NTPD Monitoring Dashboard
Go to the Grafana Dashboard page for the plugin:
https://grafana.com/grafana/dashboards/1017
Note the ID. In Grafana, choose Dashboards/Manage. Click on Import and enter the dashboard ID.
Copy the contents of the Collector Configuration Details block into the file /etc/collectd/conf.d/ntpd.conf. If the file doesn’t exist, create it.
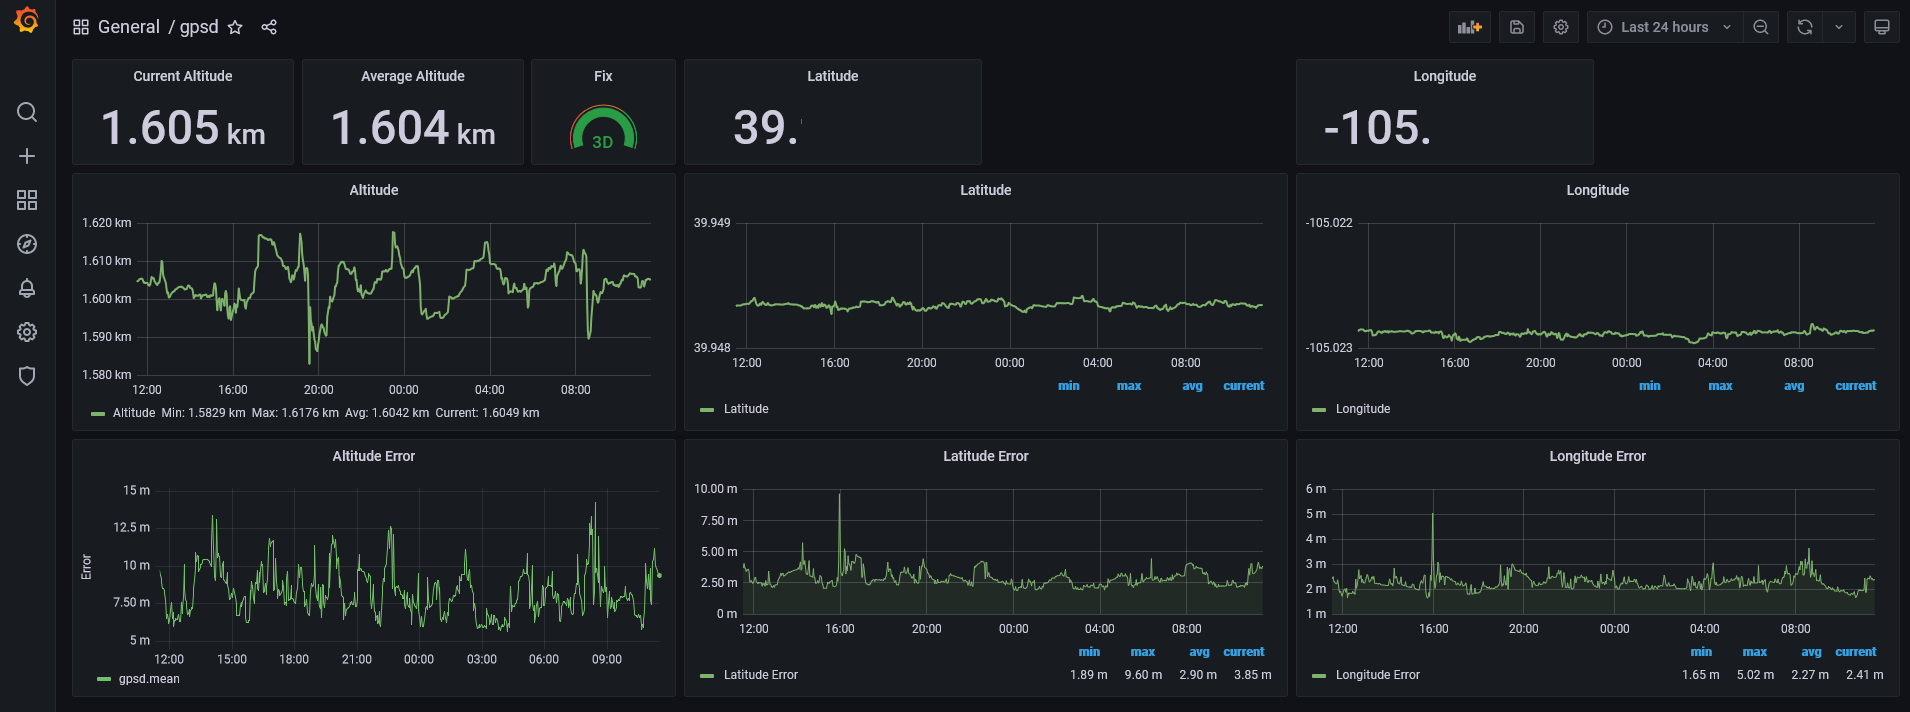
Step 6: Install the GPSD Monitoring Dashboard
Go to the Grafana Dashboard page for the GPSD Monitor:
https://grafana.com/grafana/dashboards/10226
Import the dashboard. You’ll need to setup a separate collector program to gather the GPSD data. You can find the source and more instructions here:
https://github.com/mzac/gpsd-influx
Step 7: Reboot
Now that everything is loaded and configured, reboot the pi to restart all affected services. Once the Pi completes reboot, browse to the Grafana installation:
http://your.pi.ip.here:3000/
Login to Grafana, and choose dashboards. Your new dashboards should be listed. Click on one of the dashboards. If the dashboard doesn’t work check the steps above.
Customizing Dashboards
Customizing Grafana dashboards is really easy. I’ll walk through setting up a customized altitude display. Since I live in the metro Denver area, we’re all a little nuts about knowing the current altitude. While the default dashboards show the altitude pretty well, I would like a custom panel that shows deviation from what I believe my true altitude to be. I don’t really know my true altitude, I’m using the average from GPSD over 7 days.
To get started, login to Grafana, and navigate to the GPSD dashboard. Select the new panel icon in the upper right area. Select an Empty Panel as the type of panel.
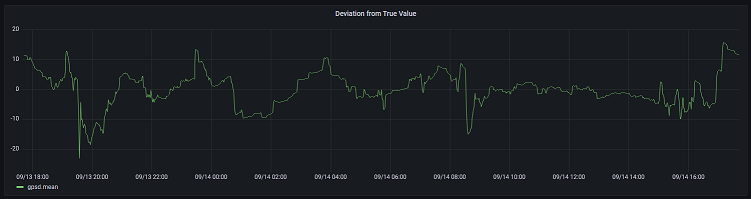
The first step is to establish my database query. TPV is a record type, and the value I want is alt (altitude). To transform the graph into a deviation from average style chart, I use “math” and subtract my nominal altitude, 1604.4 meters, from the mean value returned for the query.
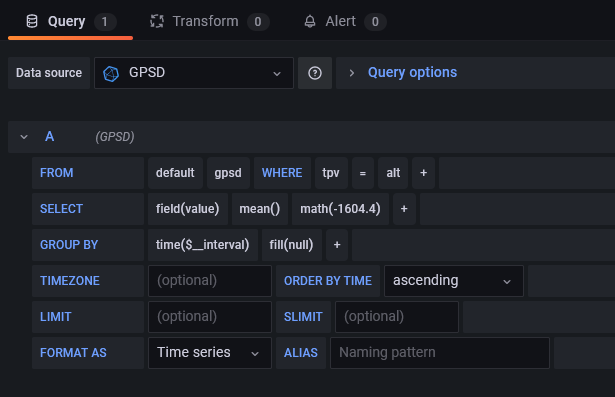
That gives me a chart that looks like this:
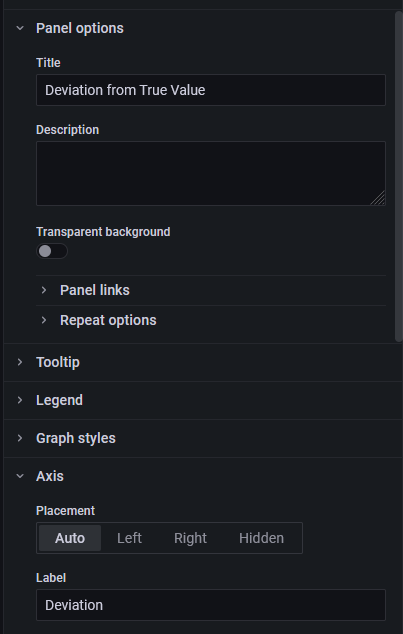
The next step is to refine the chart. In the right pane, I’ll set the Title to be “Deviation from True Value”, the Axis Label to deviation. Under Standard Options, I’ll change the units of measure to Meters. I changed the Legend to hidden, since the axis label is sufficient.
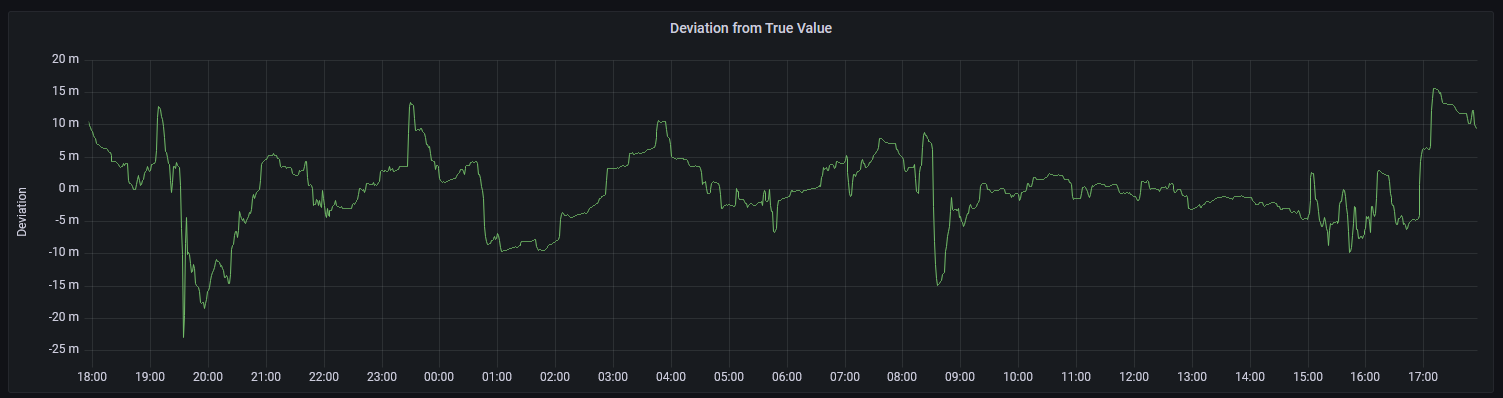
The completed panel shown above now has the altitude reading’s deviation from the true value.
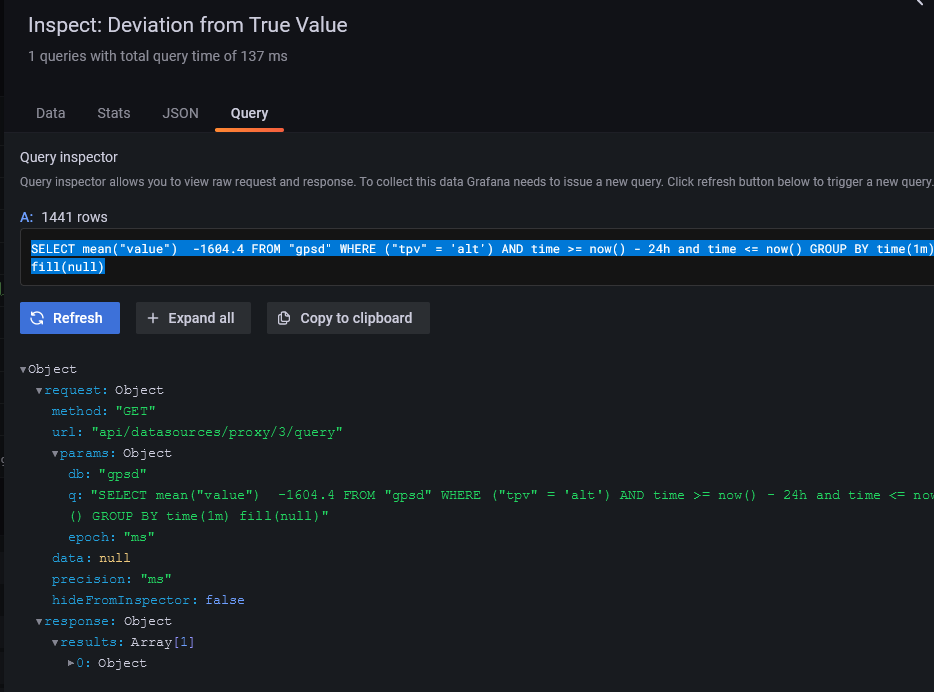
Another really cool feature is that Grafana provides a query inspector that allows you to modify the query, or create a query in Grafana and use that query from other tools.
Considerations for Using Grafana
The two primary concerns I have for using Grafana are the CPU consumption and the disk utilization.
Because the various collectors (collectd, telegraf, shell scripts) are continuously running, they use some CPU on the pi. On my Raspberry Pi 4 with 4GB of memory, the normal resting CPU utilization is running around 4% with everything running. That’s well within reason.
The second consideration is disk write utilization. Various web pages discuss the idea that the continuous writing to a time series database like InfluxDB might cause premature wear on the SD card. I haven’t done enough testing to satisfy myself if this is really a problem or not. If it does become a problem, the two options I would try are either configuring an iSCSI target for use by the Pi, or adding a USB disk to the system.
Finishing Up
Grafana is just an amazing piece of work. There are many predefined dashboards that can be dropped into place with very little work. The most difficult thing about it is learning all of the little details that have to be done to configure each dashboard. I hope this post will cut down on the amount of head scratching you’ll have to do.