For my Raspberry Pi NTP server, one of the elements that I wanted was a status screen that showed NTP statistics. The simplest way I saw to do that was to query the data using the ntpq command.
The ntpq command provides multiple sub-commands that you can use to query the state of NTP. Examples of what can be read include:
- Current Peer
- Current Offset and Jitter
- # of NTP Packets Sent
In my first effort, using Java, I executed the NTP command with the set of verbs that I wanted to retrieve data for.
private void updateNTPData() {
    try {
        Process process = new ProcessBuilder("ntpq", "-c", "iostats", "-c", "sysstats", "-c", "sysinfo", "-c", "peers").start();
        BufferedReader br = new BufferedReader(new InputStreamReader(process.getInputStream()));
        String line;
        boolean inPeers = false;
        while ((line = br.readLine()) != null) {
            // Process the lines...
        }
    } catch (IOException ioe) {
        ioe.printStackTrace(System.err);
    }
}
The part that I didn’t like about this is that it starts the process each time the data is polled. If I’m polling every 10 seconds, then that’s executing the ntpq process 6 times per minute, or some 8,640 times a day. I noticed that the ntpq command had an interactive mode. For my GoLang version, I decided that I would start the process in interactive mode and periodically send it commands.
var cmd = exec.Command("stdbuf", "--output=L", ntpqBinary, "-i")
// var cmd = exec.Command(ntpqBinary, "-i")
if cmd == nil {
log.Fatal("exec.Command returned nil")
panic("cmd is nil")
}
stdout, err := cmd.StdoutPipe()
if err != nil {
log.Fatal(err)
panic("Error getting stdout")
}
stin, err = cmd.StdinPipe()
if err != nil {
log.Fatal(err)
panic("Error getting stdin")
}
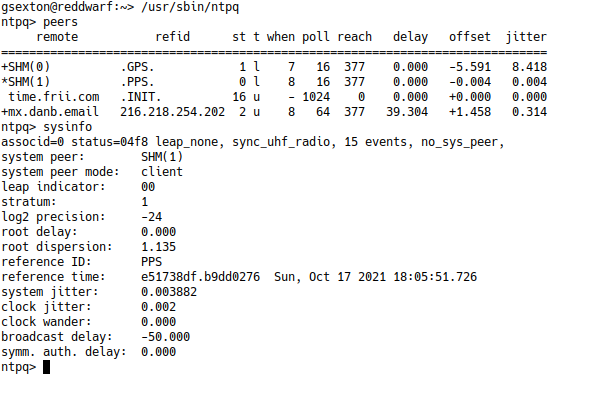
err = cmd.Start()The one problem I noticed is that when I used the program on a Raspberry pi, the data wasn’t received. I figured out that the ntpq binary wasn’t flushing the data. I use stdbuf to reconfigure the stdout file descriptor. The -i flag at the end of the command starts ntpq in interactive mode. Here’s what it looks like when you run ntpq in interactive mode:
To send the command, I transmit the ntpq command to the stdin of the ntpq process:
_, err := io.WriteString(stdin, command+"\r\n")
To read the input, I have a separate goroutine that collects the lines:
go func() {
    var scanner = bufio.NewScanner(stdout)
    defer func() {
        log.Println("NTPD Monitor - Closing NTPQ Channel")
        io.WriteString(stin, "exit\r\n")
        log.Println("NTPD Monitor - Exit sent")
        time.Sleep(2 * time.Second)
        stin.Close()
        stdout.Close()
        log.Println("NTPD Monitor - Sending kill")
        ntpCmd.Process.Kill()
        ntpCmd.Wait()
        ntpCmd = nil
        scanner = nil
    }()
    scanner.Split(bufio.ScanLines)
forloop:
    for scanner.Scan() {
        select {
        case ch <- scanner.Text():
        case <-closeChannel:
            break forloop
        }
    }
}()
As the scanner receives each line, it writes them to the channel. The parsing code then reads from the channel. While it may seem overkill to have a separate goroutine that just reads the data, it solves a problem. That problem is that if somehow the ntpq binary stops responding, the read routine won’t block indefinitely waiting for input.
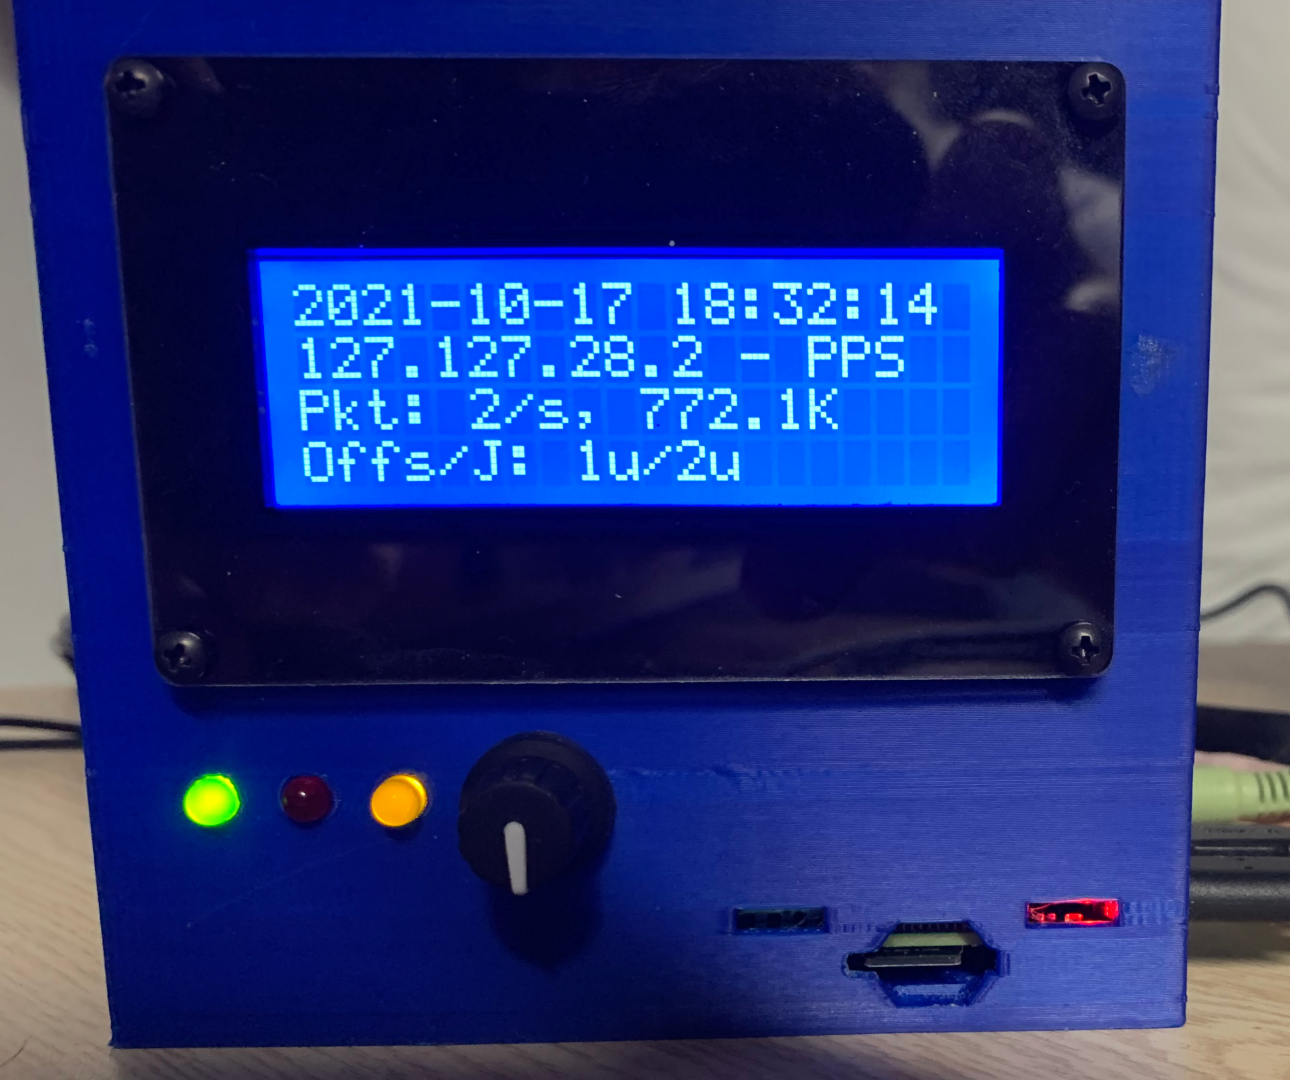
The Final Output Screen
The final output screen show on the right is the completed NTP status screen. It shows the current date/time, the current peer (who NTP thinks is the best source of time data), the number of packets sent, and the offset/jitter.
In addition to the monitor screen, the daemon monitors that the peer is the expected one. Monitoring the peer ensures that if something happens with the GPS receiver, and NTP decides that it’s not a good time source, the alarm is raised.
Additionally, it monitors that the offset value is not more than a configured amount. That way if the time isn’t matching up with the PPS source from the GPS receiver, I’m notified.
Problems
During the development, I ran into a few different problems. The first was one already mentioned. On the Raspberry Pi, the output of ntpq was buffered. I browsed the source code of the ntpq command and introduced some flush() statements, but it didn’t help. In the end, I used stdbuf as a work-around.
The second problem I ran into is that if I terminated the monitoring daemon, ntpq was left running in the background AND since the file handles were invalid, it would immediately start consuming 100% of the CPU. I made a custom version of NTPQ that checks if the stdout file handle is closed, and if so, it terminates the program.
The other problem is that even with stdbuf, sometimes when you send commands, the output doesn’t come out. I’ve tested running ntpq with -n, and the hangs were resolved. The DNS resolution code in ntpq doesn’t cache addresses, and it’s single threaded, so DNS lookup can take a while. Also, I need to look at the code for ntpq and see if it it’s using the Linux resolver’s default DNS lookup retry of 3.